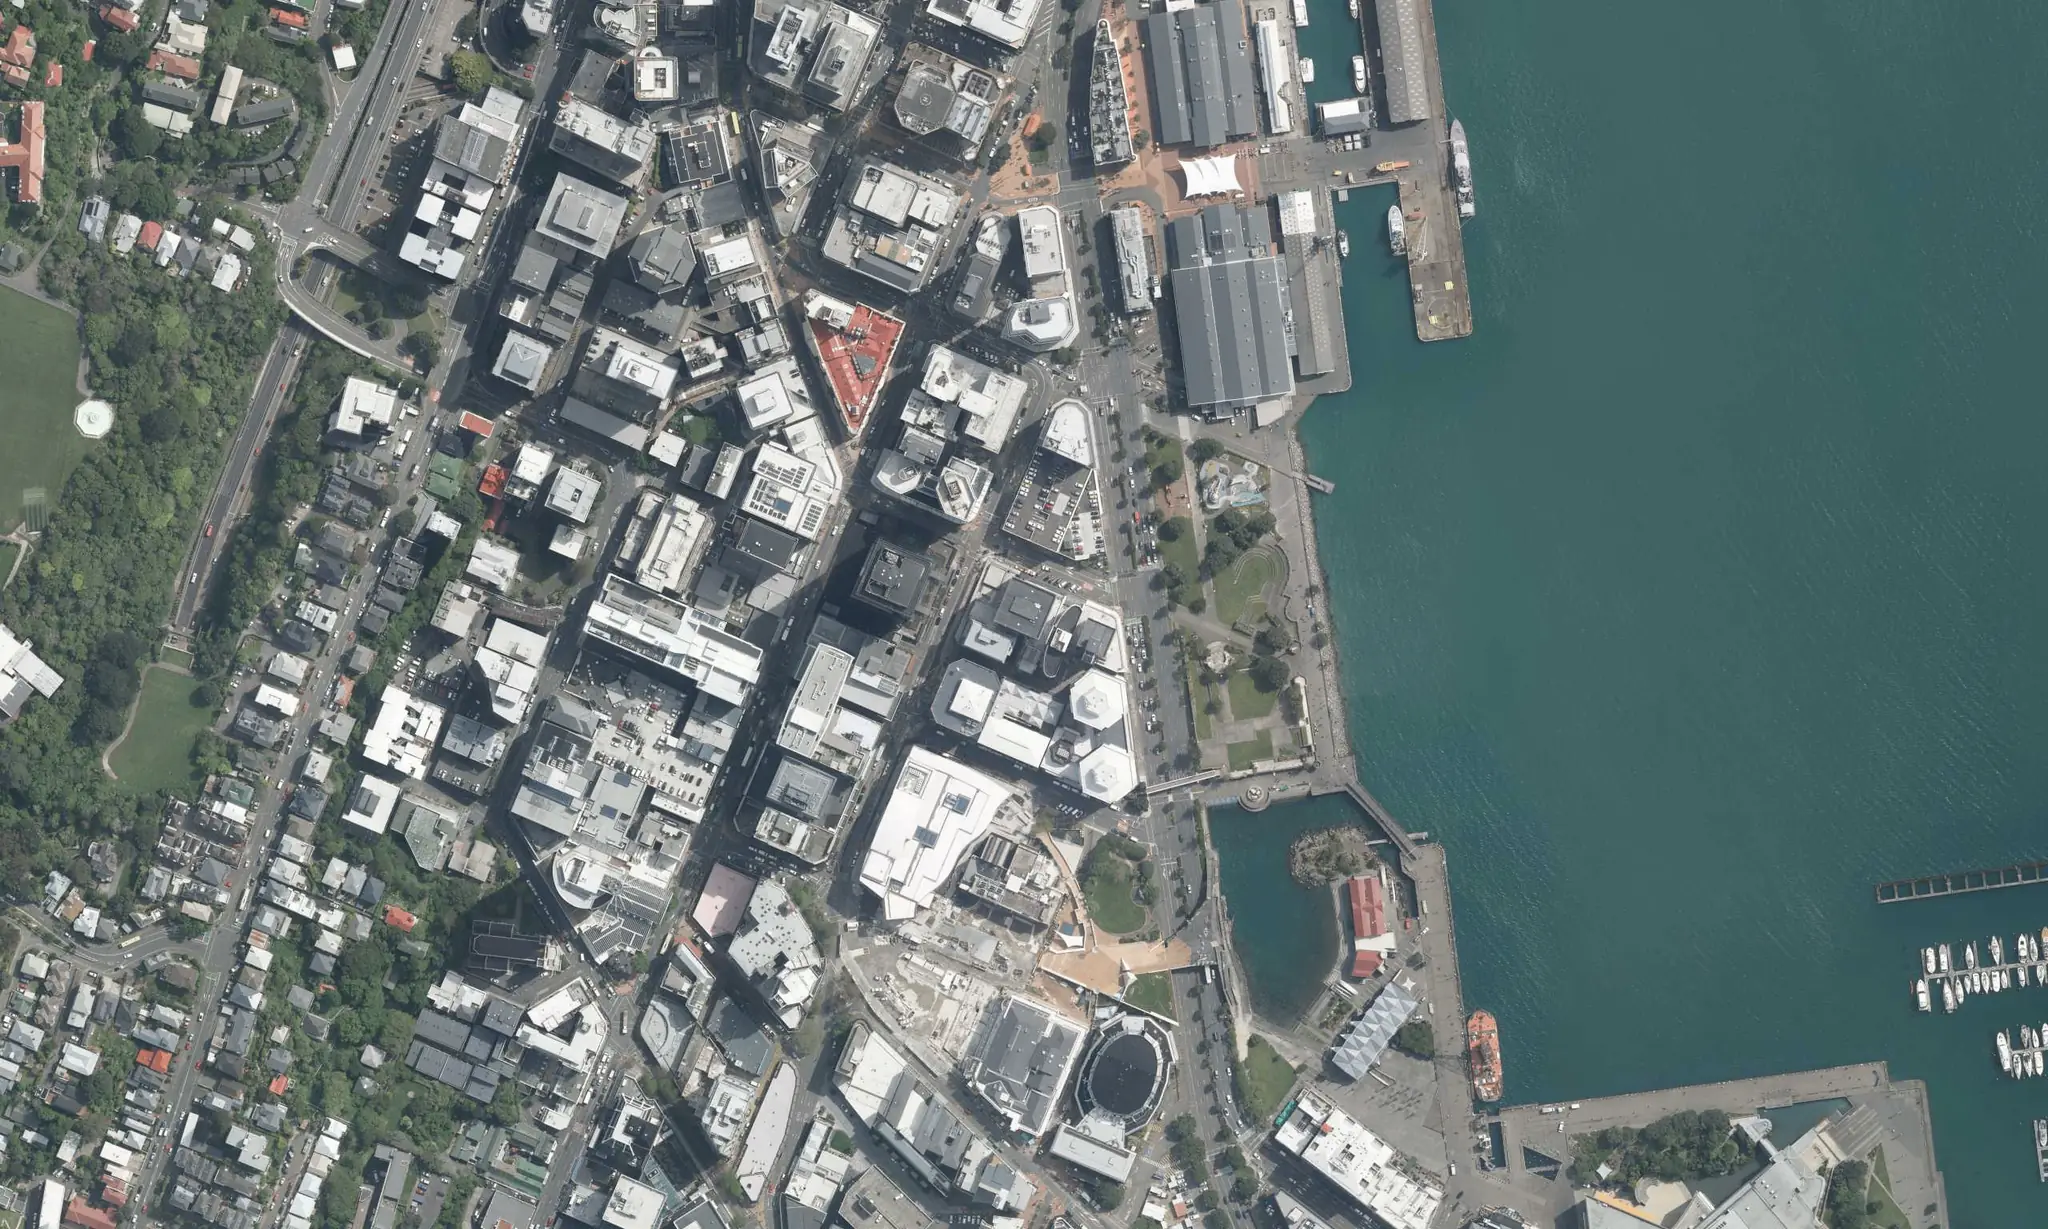
KxAI: the AI analyst built into Koordinates
KxAI is built into Koordinates. It works on your data, the Public Data Catalog and the Data Indexes, in the same map viewer your team shares.
Ask in plain language. Get an analysis, not a list of layers.
Runs real analysis
KxAI writes and runs real analysis steps in a code execution environment. It samples, clips, joins and counts across layers instead of just finding and styling them.
Builds real rasters
The result is a real raster, not a picture. You can change the colour ramp, check values anywhere on the map, and download it as a GeoTIFF.
Measures along the road
Ask how far every part of a district is from the nearest GP, school or service, measured along the road network, and KxAI builds a continuous surface from vector data and puts it straight on your map.
Draws results in 3D
KxAI extrudes by what the data says, not just by height: the best-served, leafiest parcels stand tall and green, the weakest sit low and red.
Clips, joins and counts
Network routing, spatial joins and scoring across your layers, computed on the fly and rendered with a legend that carries the headline numbers.
Shows who is affected
It can also pull in population data to show who is affected, so a result is weighted by people, not just by area.
It shows its working
- The panel documents every source and step so you can check the working or change the bands.
- KxAI also makes judgement calls and explains them. You can see that reasoning in the chat, and ask it to re-weight the trade-off if you'd balance it differently.
- It checks its own work too: ask whether a data gap is skewing the scores, and it reruns the numbers.
One prompt, one map
Three real prompts, each answered on the map in the same viewer.
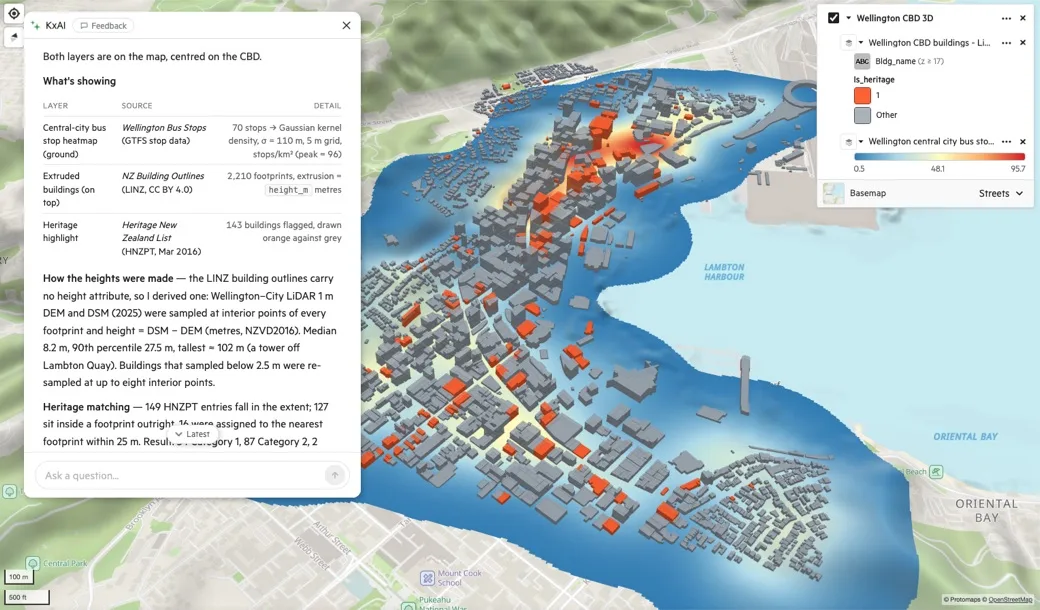
Wellington, New Zealand
“Make a heatmap of bus stops across Wellington’s central city, then extrude buildings in 3D by height on top and highlight heritage-listed buildings in a contrasting colour.”
From that one prompt, KxAI turned 70 bus stops into a density surface and extruded 2,210 building footprints from LINZ. It then picked out 143 buildings on the Heritage New Zealand List in orange.
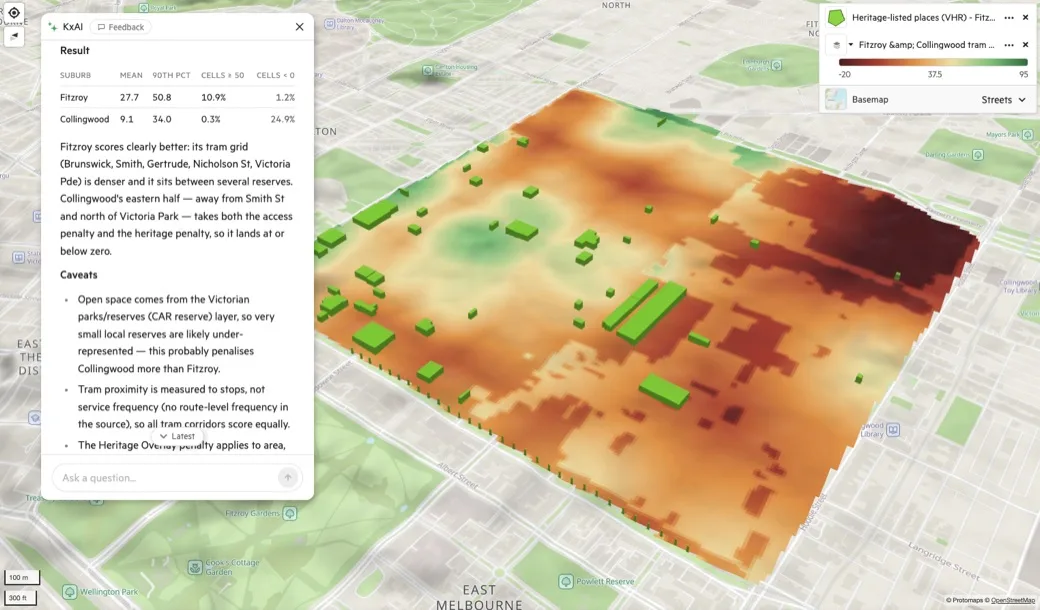
Melbourne, Australia
“In Fitzroy and Collingwood, score each area on closeness to trams and parks, subtract a penalty for heritage overlay, and show the result as a raster with heritage-listed buildings on top.”
Fitzroy averaged 27.7 and Collingwood averaged 9.1, with a quarter of Collingwood scoring below zero once the heritage penalty applied.
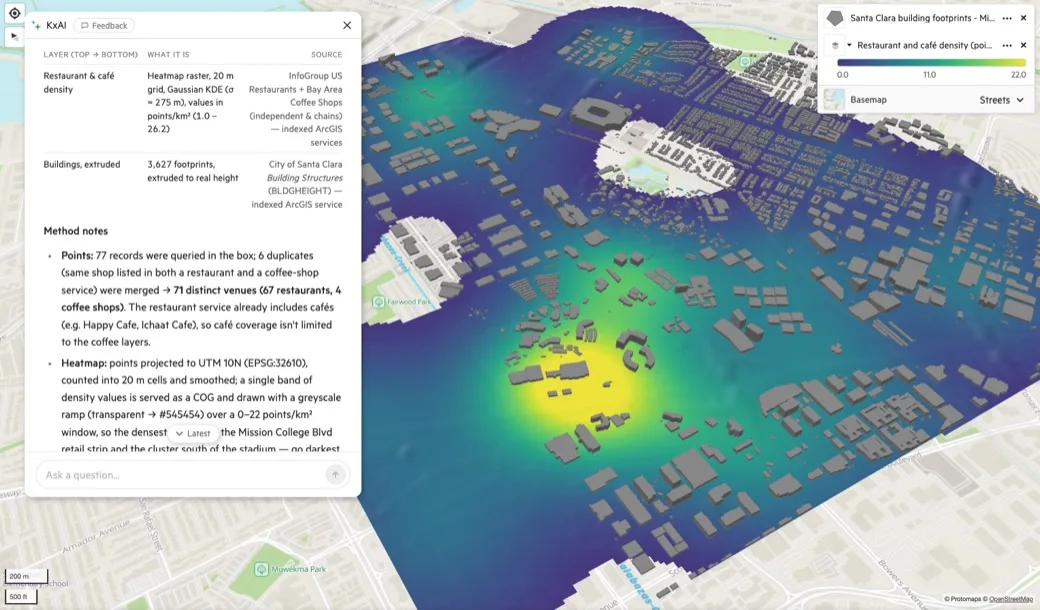
Santa Clara, California
“Create a heatmap of restaurants and cafés around Santa Clara’s Mission College and Levi’s Stadium area, then extrude buildings on top in 3D, all in a single neutral gray.”
KxAI pulled restaurant and coffee shop layers from two indexed sources and merged the duplicates, leaving 71 distinct venues.
Use it from Claude and ChatGPT too
Koordinates MCP connects Claude and ChatGPT to the same data: your layers, the Public Data Catalog and the Data Indexes. AI Pro User includes the connection. On the Team Cloud Plan, MCP Seats are a per-person add-on for the people who work from Claude or ChatGPT, at $7 a month each, or $NZ 9 in New Zealand.
Two ways to get KxAI
AI Pro User
For one person- The KxAI Map Analyst in the map viewer
- The Public Data Catalog and your region's Data Index
- Bring your own private data
- The MCP connection for Claude and ChatGPT
Team Cloud Plan
For a team- KxAI Seats, assigned by an admin
- AI credits shared across the account
- Shared map viewers and a private branded site
- MCP Seats as a per-person add-on
Questions about your own setup?
If you need KxAI on your own infrastructure, or for a larger organisation, tell us what you need.
Talk to us